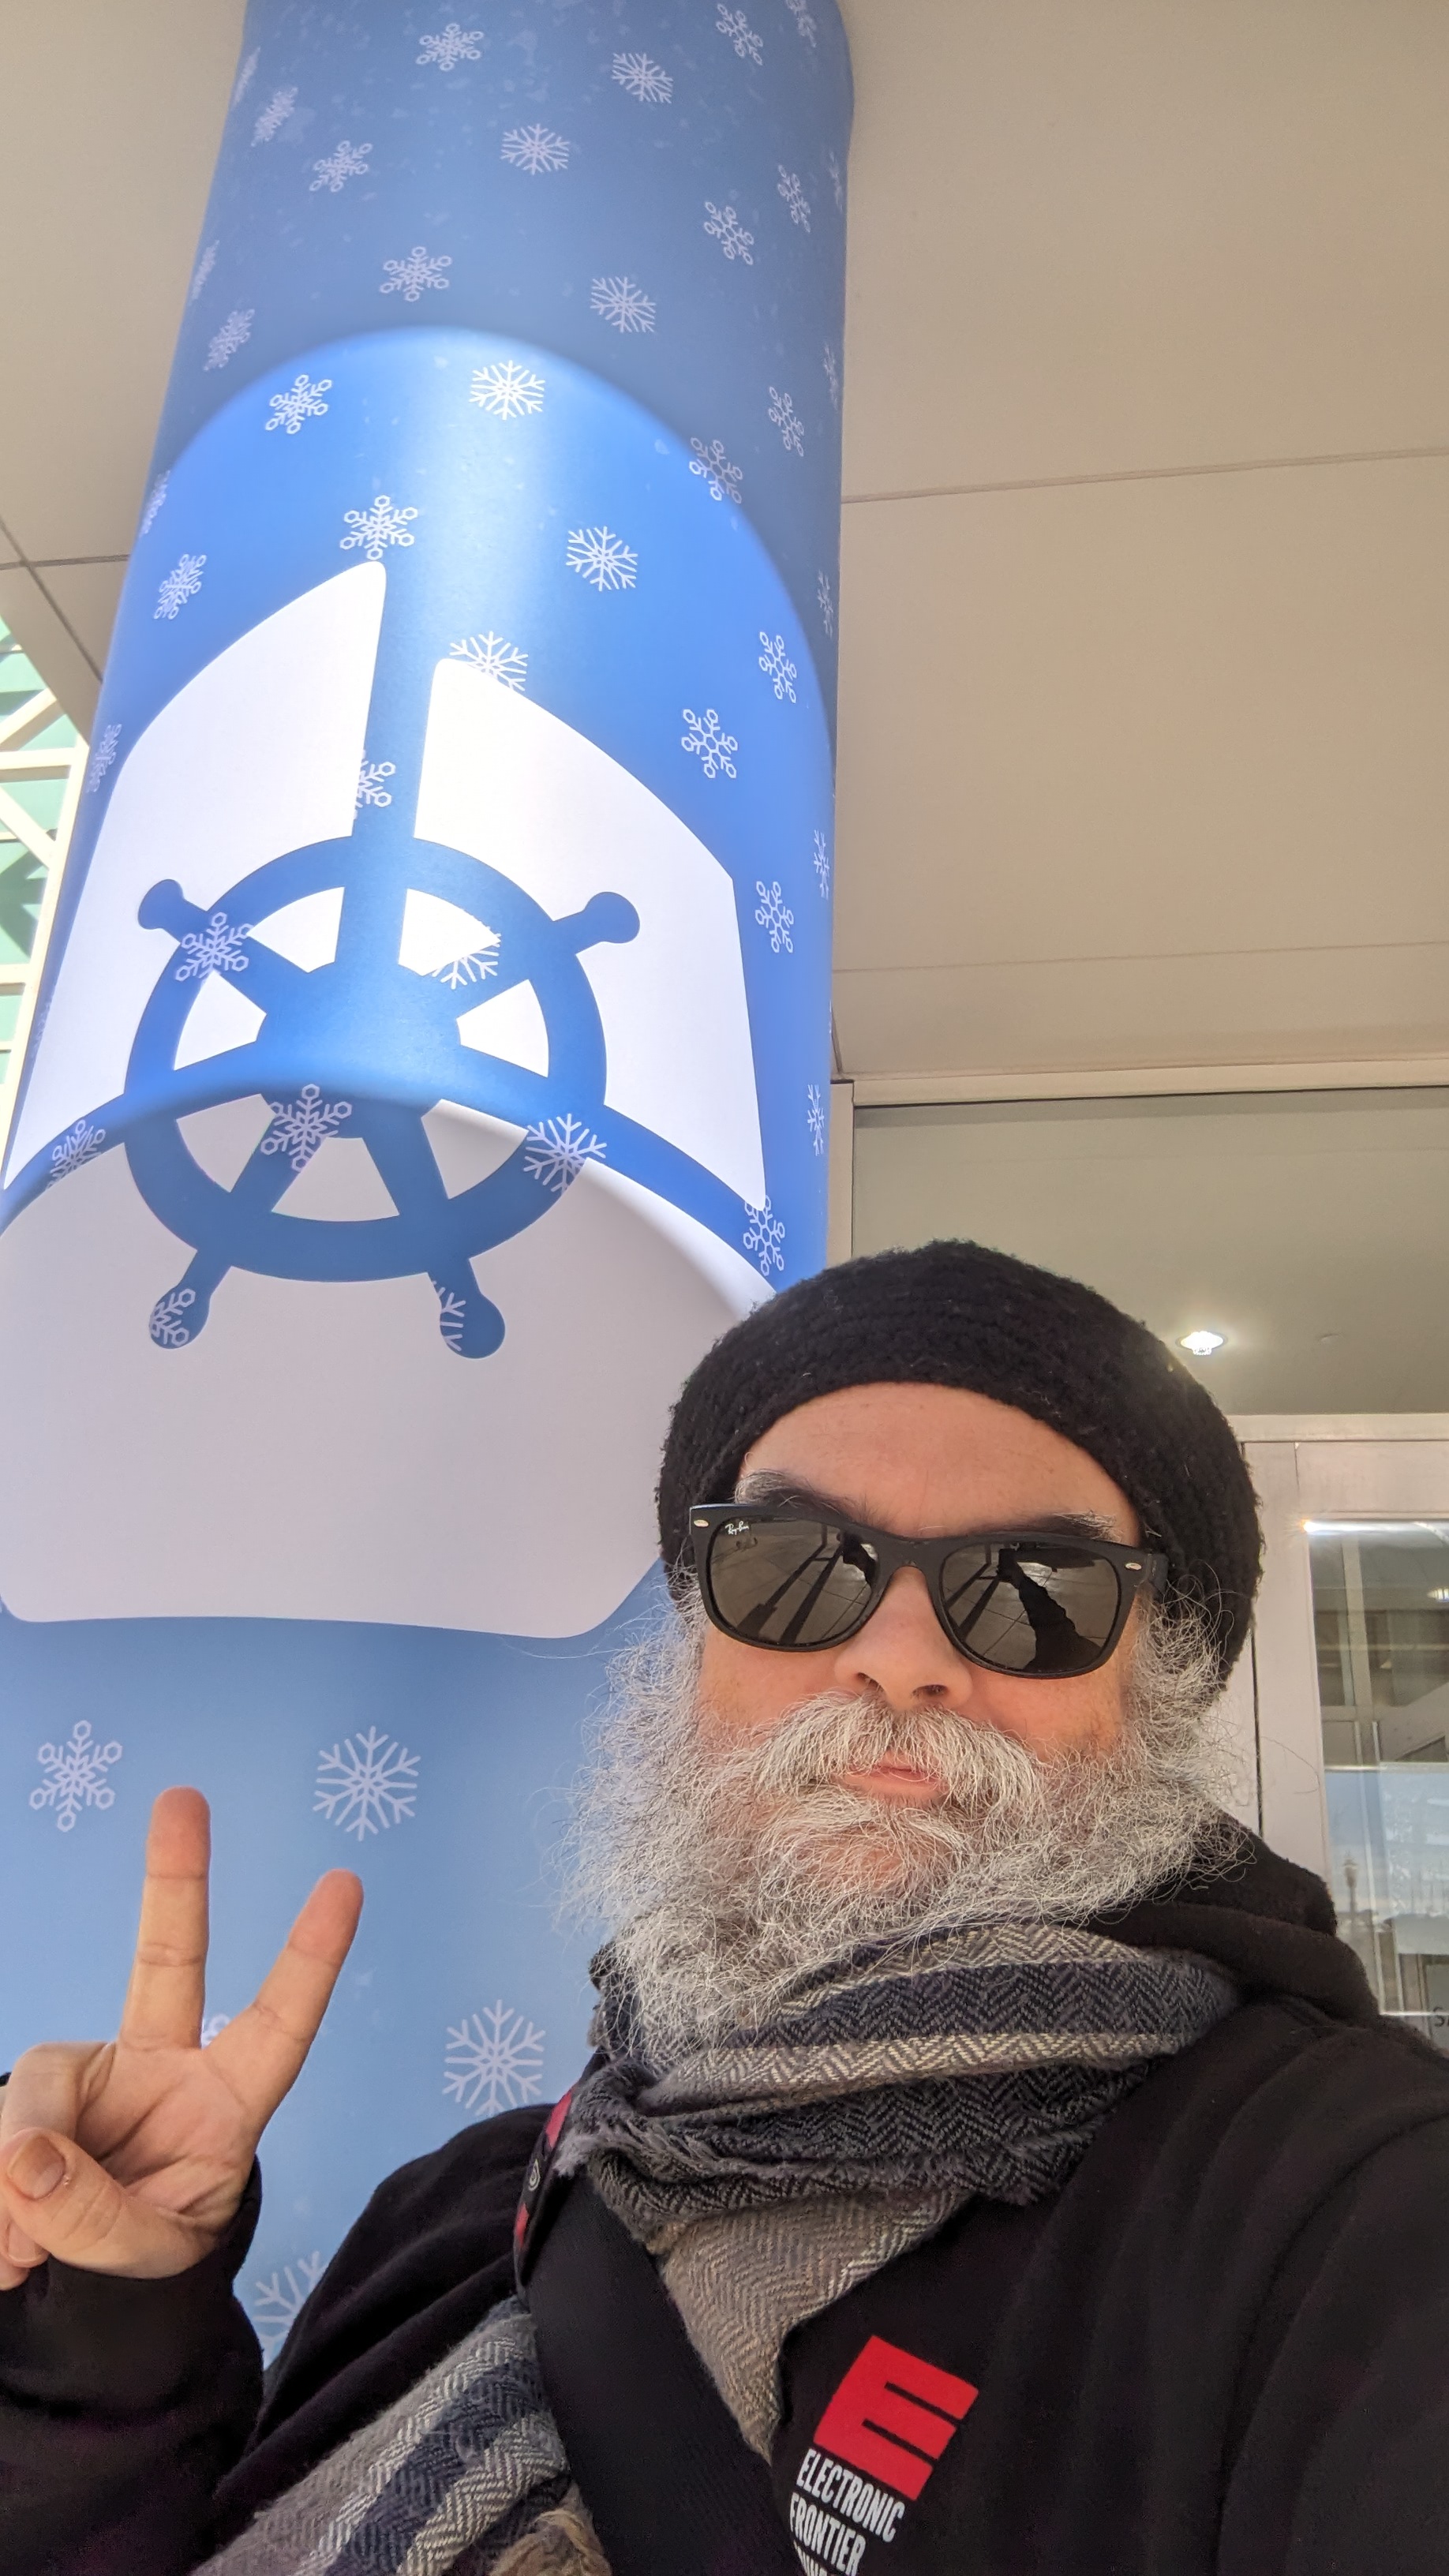
I attended KubeCon North America 2024 in Salt Lake City last week and this is my retrospective on the trip.
KubeCon North America for 2024 was hosted in Salt Lake City from November 13th through the 15th, with three days of events before the conference. In addition to KubeCon, I attended the Cloud Native Rejekts on Sunday the 10th, the Kubernetes Contributor Summit on Monday the 11th, and OpenShift Commons on Tuesday the 12th. The weather was mostly nice, with a little rain on Tuesday, with temperatures generally cool in the mid 30s to high 40s Fahrenheit. Salt Lake City is easy to get around, it has generally large blocks and roads in the downtown area, there is also public transportation, and an amazing view of the mountains from just about everywhere.
Cloud Native Rejekts, Sunday November 10
Cloud Native Rejekts is a conference that bills itself as “… the b-side conference giving a second chance to the many wonderful, but rejected, talks leading into KubeCon + CloudNativeCon”. It is usually a great place to see high quality talks in a smaller setting than KubeCon, and an opportunity to meet up with other people to talk about Kubernetes before the main event.
This year, I was presenting a talk with colleague David Morrison from the Applied Computing Research Labs titled “Karpenter and Cluster Autoscaler: A data-driven comparison”. We had about 20-25 people in the audience, and it went fairly well considering we had some issues with latency on the slide display.
On Sunday, there were probably around 200 people in attendance at Rejekts. There were 2 presentation areas: the main theater, and the flex room. Most talks saw people filling the rooms and I noted several with crowds standing in the hall to catch the topics (the eBPF talks were popular). I met several old friends during the social time for Rejekts and it was a great “pre-game” for KubeCon. If you are ever coming to a KubeCon and have the inclination and opportunity to arrive early, Cloud Native Rejekts is a free event and the talks are focused on technical topics, I recommend checking it out at least once.
Kubernetes Contributor Summit, Monday November 11
The contributor summit is my favorite part of KubeCon. The amount of high-bandwidth conversations and learning that I do during the summit is unparalleled for me at any other Kubernetes event. This year was no different. I’m not sure on the total attendance numbers for the contributor summit, but I would not be surprised if there were a few hundred people there throughout the day. We had several general sessions, including an awards ceremony, and breakout rooms with pre-planned and unconference topics.
I felt that one of the big topics for this summit was getting to know and understand the steering committee. We had a good panel session with the committee and it generally seemed like they wanted the contributor community to understand what the steering committee does, and how we can lift more voices to join the committee. I found this to be a good topic of self-awareness for the Kubernetes contributor community, and I continue to be impressed at the thoughtfulness of this community in terms of attempting to keep itself healthy, active, and inclusive.
There were 2 talks I attended during the summit that I would like to call attention to:
- Official Kubernetes CRDs: Where to from here ? - Nick Young, Isovalent, Rob Scott, Google
- Unified framework for unit, integration, and E2E testing - Patrick Ohly, Intel
I found the talk on CRDs interesting because for many years now the Kubernetes community has been attempting to address several issues around CRDs (versioning and migrating to name two) and this talk was moving the ball forward on those issues. I also found the talk on testing to be interesting because the author is proposing a test framework that should be built specifically for Kubernetes to address the specific needs of test writers. There seems to be a good opportunity to help push the Kubernetes tests towards a more unified approach, and bring in more contributors who might want to join the testing efforts.
Aside from the talks, a big part of attending the contributor summit are the project meetings. I am an active contributor to the Cluster API project and I attended their project update session. This year was not as well-attended as previous years with only around 10-20 people in attendance, but we had a great discussion about the future of the project. Some of the topics we covered during the discussion were the in-place upgrades proposal and status, and etcd resiliency in Cluster API clusters.
OpenShift Commons, Tuesday November 12
OpenShift Commons is a Red Hat sponsored event where we talk about all things Red Hat and OpenShift. I volunteered to help with operations and also to be part of the round table discussions representing the OKD community with my peers Amy Marrich and Jaime Magiera.
I love attending the OpenShift Commons, not only because I work on OpenShift and it’s a great opportunity to meet with users, customers, and partners, but also because it’s a great chance for me to spend some time with other Red Hatters. It was a really nice event and it seemed like we were nearly packed to capacity. I’m not sure how many people were there but it had to be a few hundred.
The round table discussions were interesting and I ended up talking with a few folks about how using OKD (the community supported version of OpenShift) could help their operations team in sketching out features they would like to see in OpenShift someday. The idea being that if you would like to see a feature in OpenShift, and you have some technical understanding around OpenShift and the feature, then you could use OKD to add the feature and demonstrate a proof of concept. This seemed to resonate with the people I talked with, although we all admitted that there is a significant engineering resource demand to create these types of demonstrations.
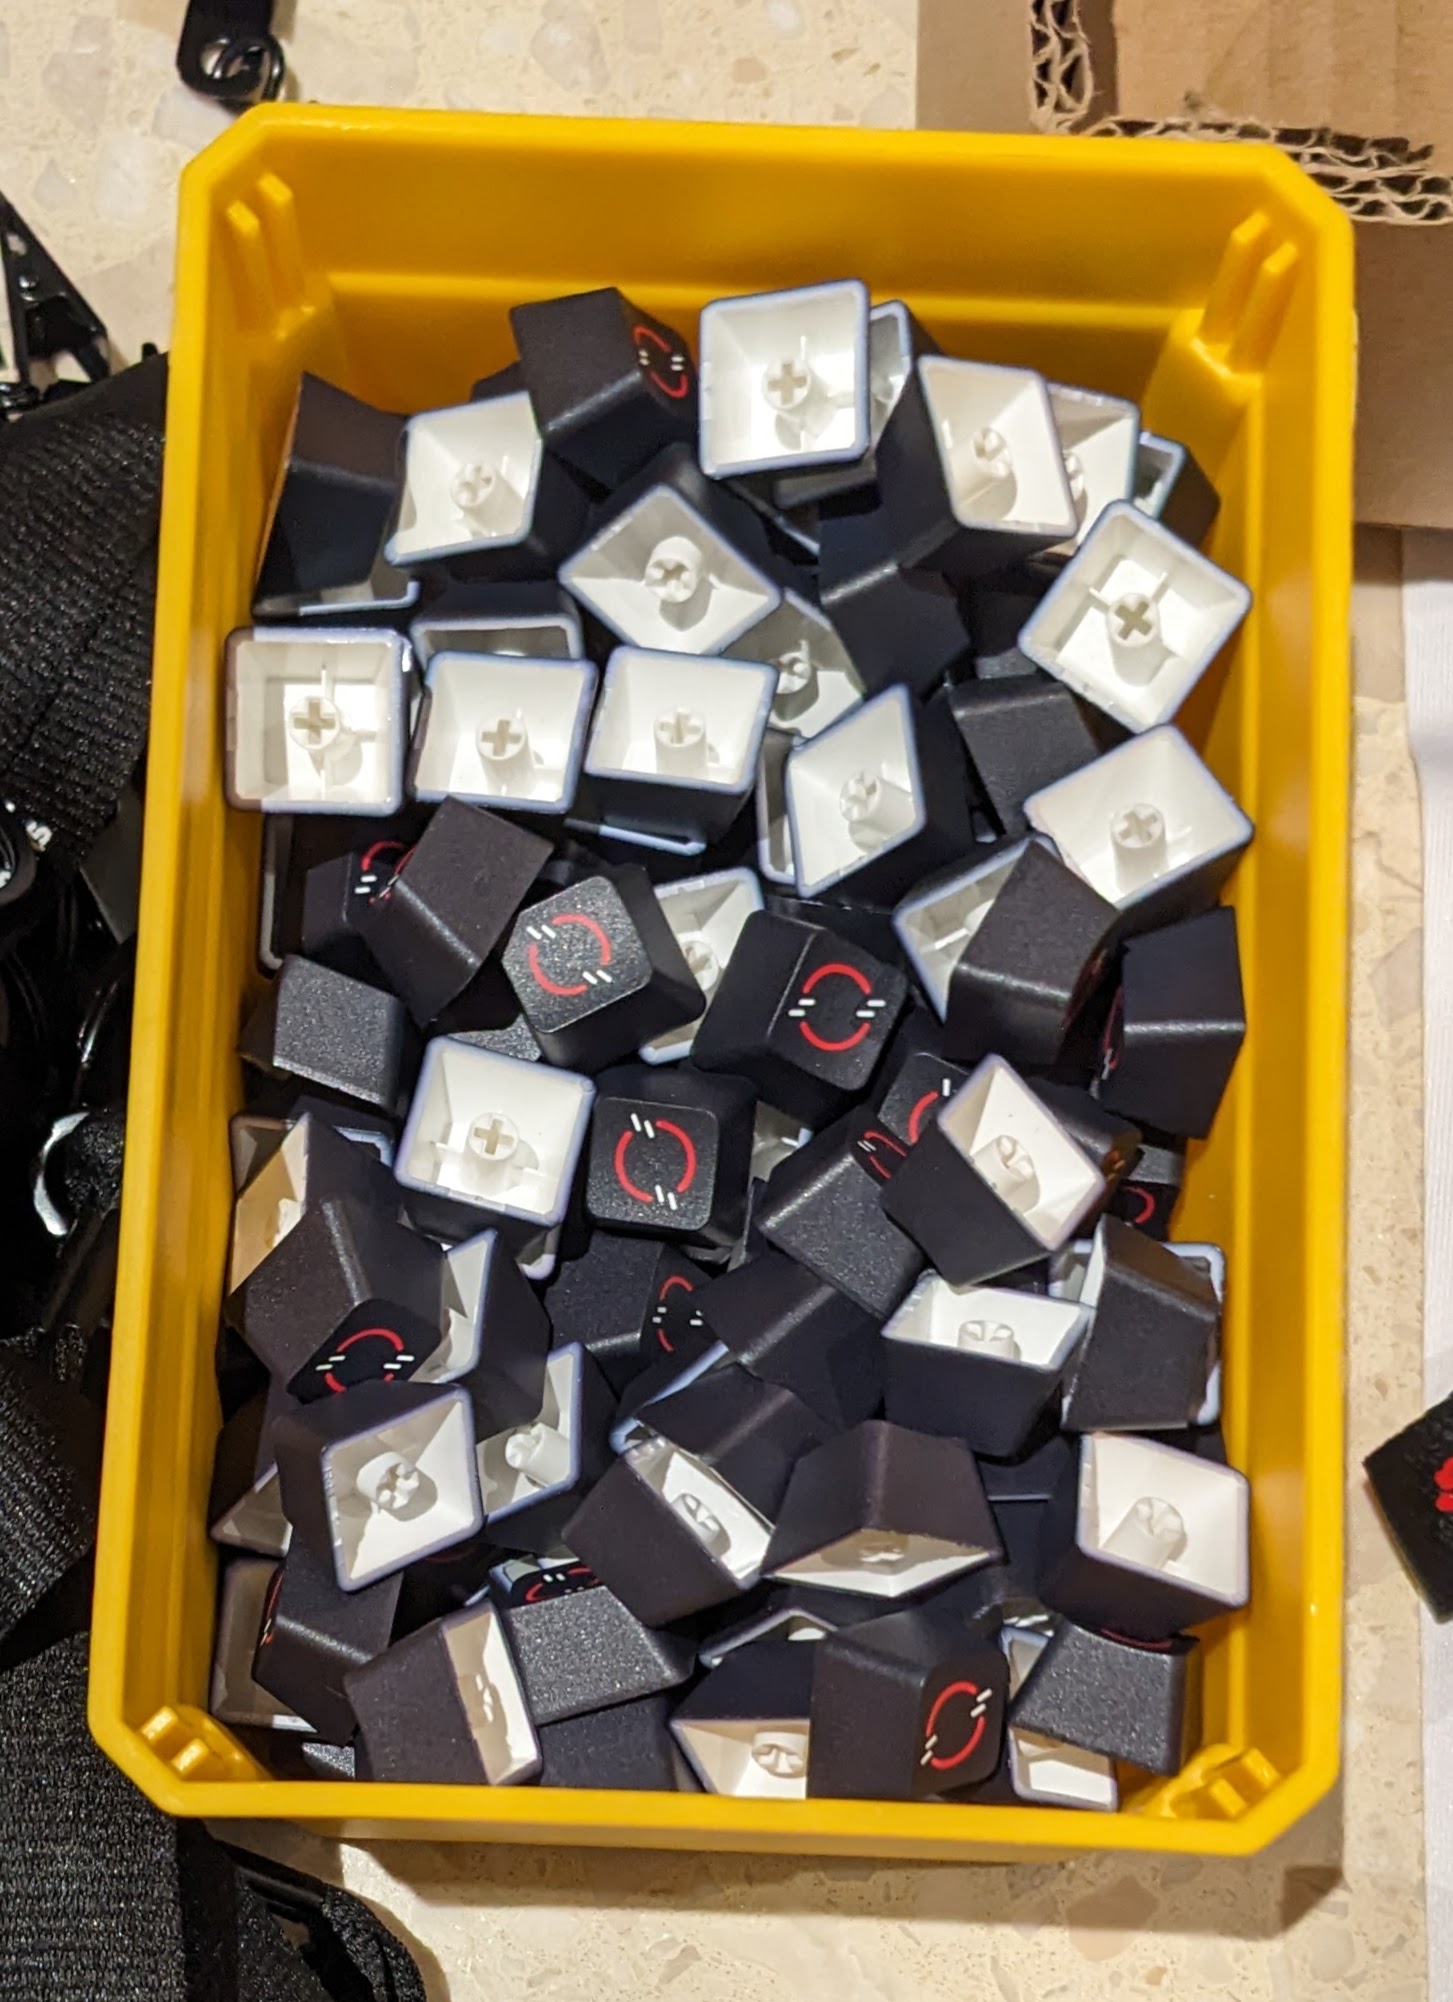
Commons also had one of the best pieces of OpenShift swag I have ever had the pleasure of snagging: OpenShift keycaps!
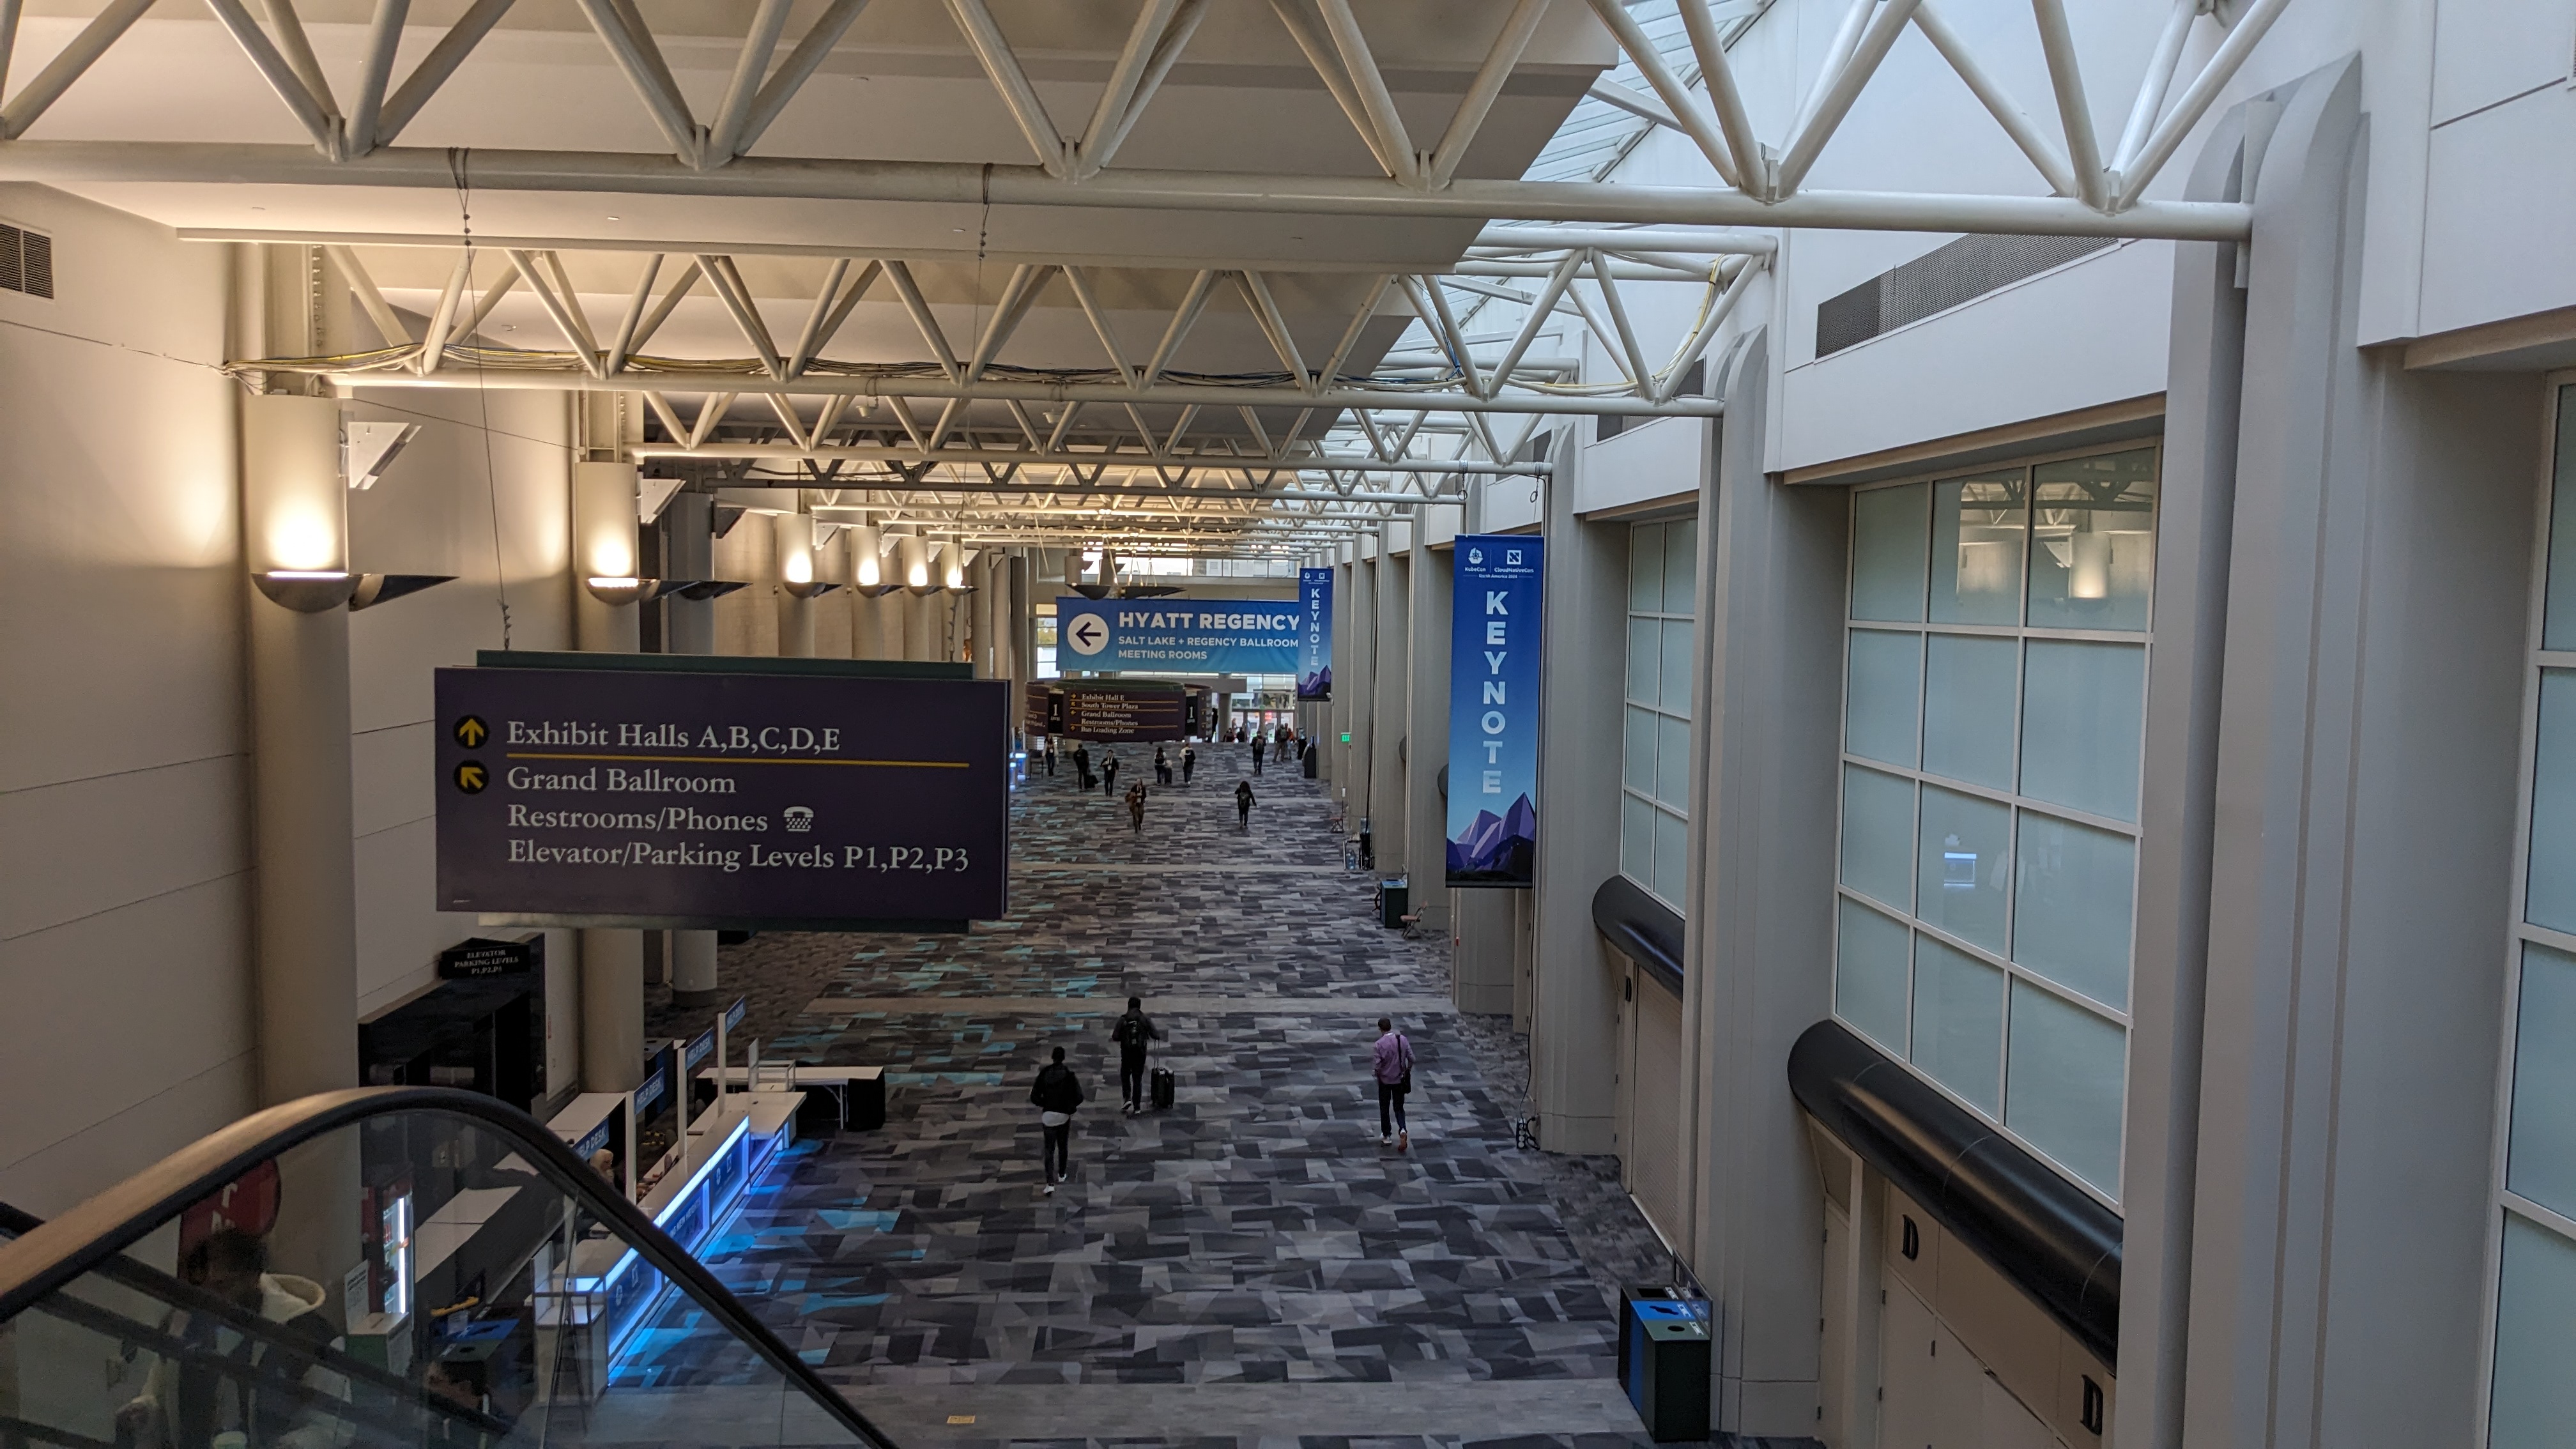
KubeCon Day 1, Wednesday November 13
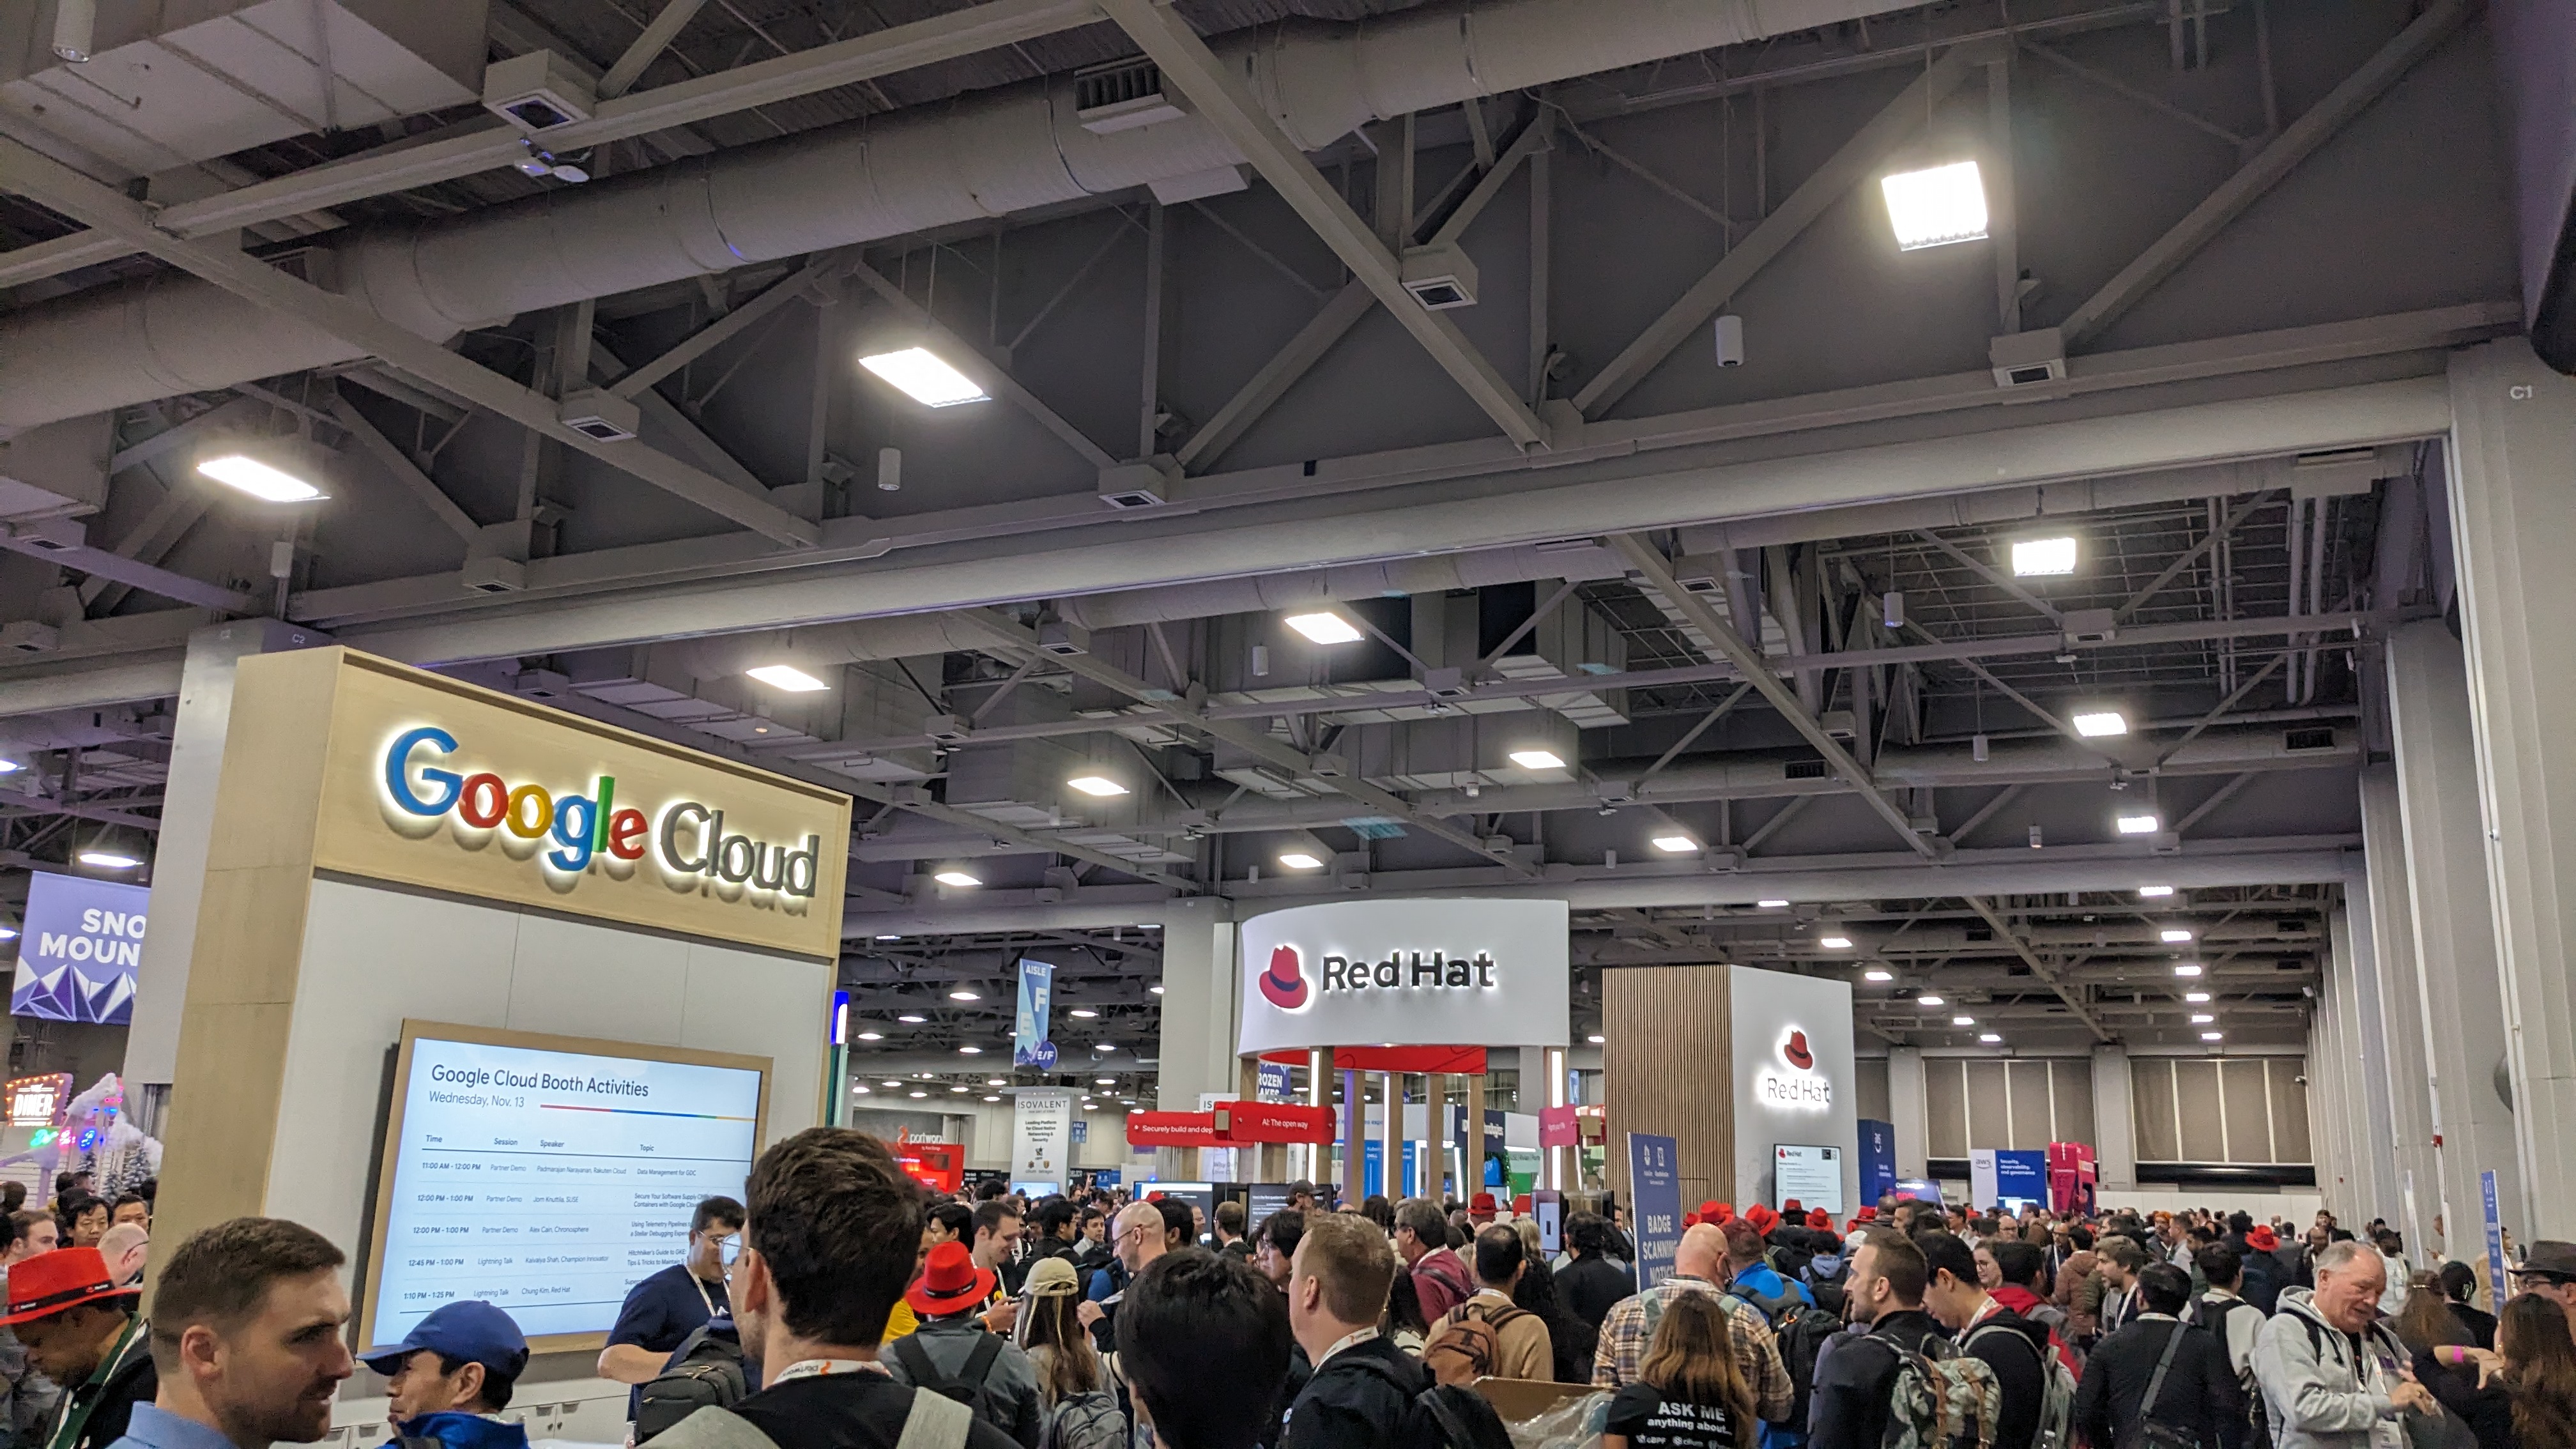
Wednesday brought the official start of KubeCon. I followed the herd (we were told attendance reached 9,200 people this year) to the first day keynotes and with that, KubeCon had begun. Two of the big themes for this KubeCon were AI, and security, with the first two days being dedicated to those topics respectively. The first day keynotes seemed well attended and there was a buzz in the air that was familiar. Immediately after the keynotes was the stampede to the exhibit hall.
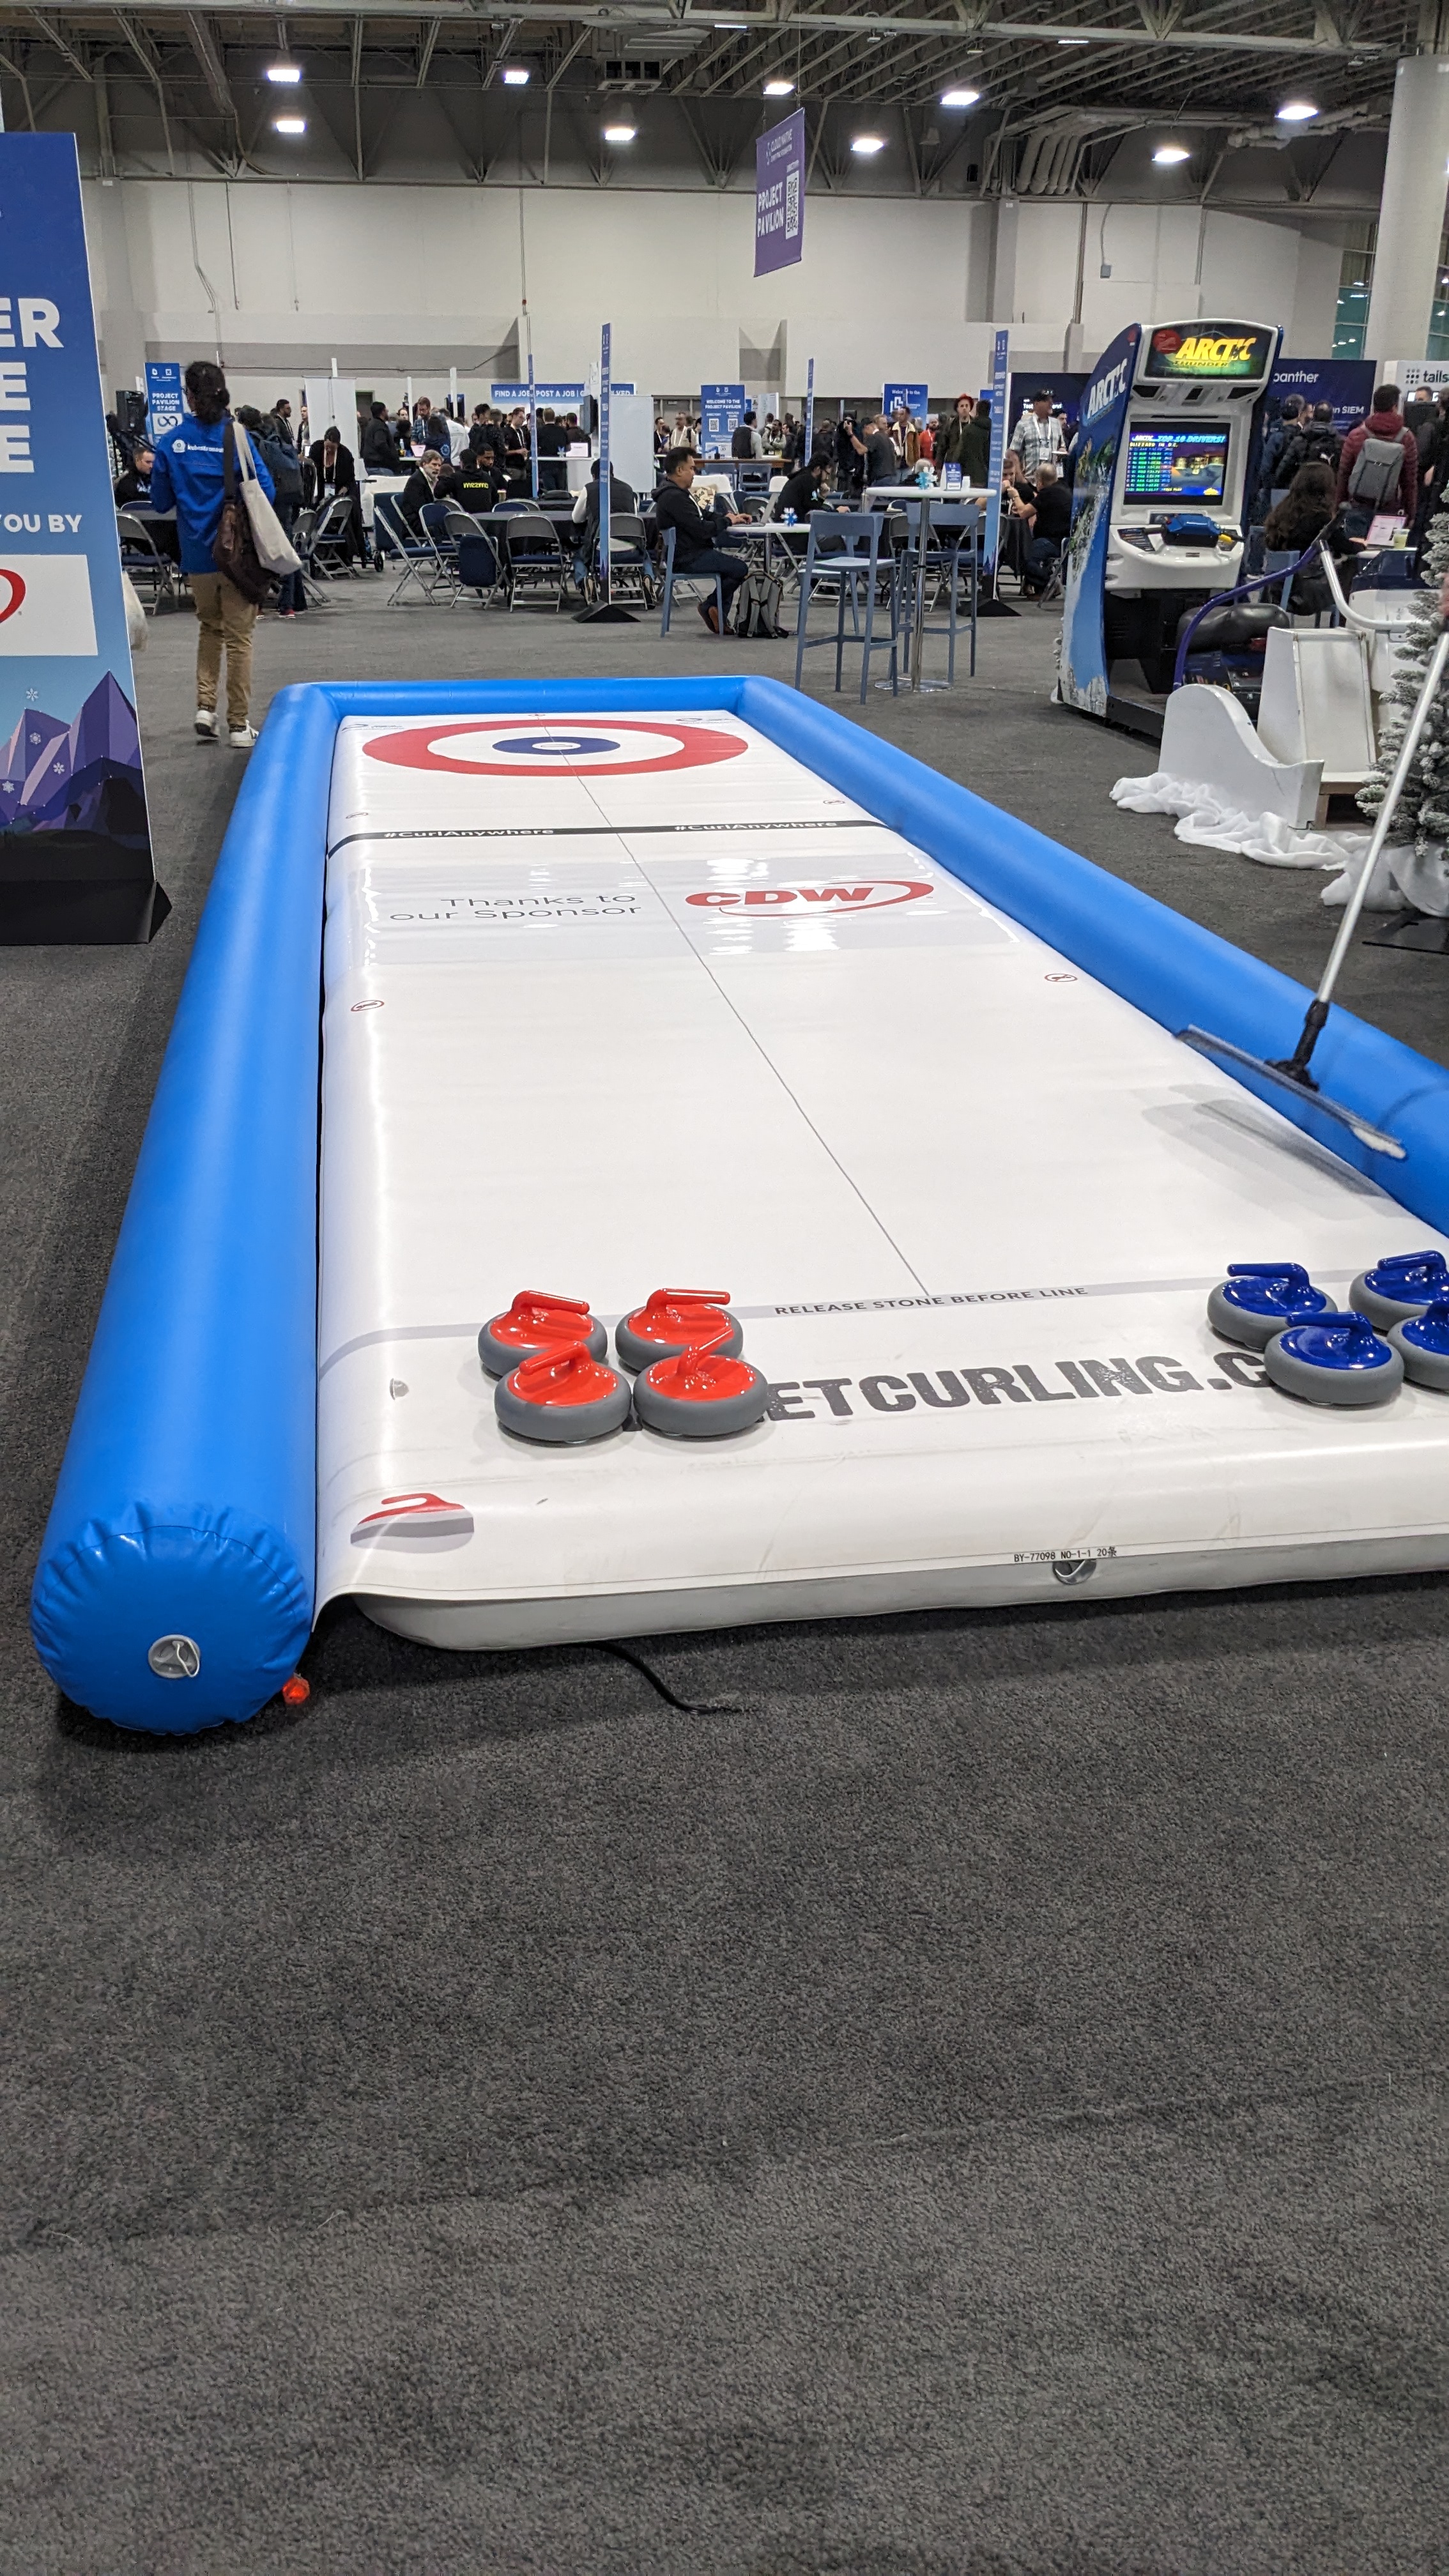
The exhibitor hall was fun, as usual, with some special highlights being the pickleball court and the inflatable curling. It didn’t feel over-crowded or empty, and the times I visited there were plenty of people walking around. The project pavilion was also in the exhibitor hall and I ended up doing an unscheduled impromptu demonstration of the Karpenter Cluster API project, which was fun but also chaotic. This demonstration led to several hallway track conversations on Wednesday about Karpenter and Cluster API. While AI and security were the conference themes, one of my themes for the week was definitely Karpenter as I got into many more conversations about it than I anticipated.
I saw a bunch of talks on Wednesday, and I would like to call attention to a couple that I think are worth watching when they are posted:
- Architecting Tomorrow: The Heterogeneous Compute Resources for New Types of Workloads - Alexander Kanevskiy, Intel Finland – Watch on YouTube
- From Observability to Performance - Nadia Pinaeva, Red Hat & Antonio Ojea, Google – Watch on YouTube
The first talk on heterogeneous compute resources gave a window into the future of exposing more details about processors to help make scheduling and processing more efficient. Alexander gave a nice overview of how different workloads can be adversely affected by some processor architectures. In a world where nanoseconds can make a difference, this is a great talk to understand how to identify and minimize those bottlenecks.
The second talk was a deep breakdown of how networking metrics can be used to identify performance limiters and speed bumps in your infrastructure. Understanding networking failures is difficult enough without all the layers that cloud native infrastructures add. Being able to see real world uses of the metrics alongside the methodology for understanding the implications of those metrics was enlightening for me.
Near the end of the day, I ended up getting into a deep discussion with some friends from SIG Storage (shoutouts to Hemant, Jan, and Michelle). They had been chatting all day about a storage issue related to CSI drivers and the Cluster Autoscaler. It was an interesting discussion and I think after about an hour or two we had made some progress on possible solutions, now if only we could find the time to work on them!
Wednesday evening was also the “Booth Crawl” at the exhibitor hall, but as I had dinner plans with my colleagues from Red Hat, I skipped out for the evening.
KubeCon Day 2, Thursday November 14
Day 2, I’m exhausted but driven forward by excitement and the goal of delivering a talk on Friday.
For the first time in my KubeCon history, I attended a workshop on the DEI track. I saw this title in the schedule and, given my interest in building healthy open source communities, I felt that I had to attend:
I was rewarded with an hour of discussions and group activities where I got to hear about some common issues related to inclusion, and then got to spend time talking with people about their experiences. I had a good time and learned a little more about what I can do to help build more inclusive communities, and what to look for when things aren’t quite going right.
I do a lot of work with the Cluster Autoscaler and Karpenter projects, so I was keenly interested to see the SIG Autoscaling update, delivered by my friend from the Cluster API community, Jack Francis. It was a nice overview covering all the projects that the SIG sponsors, how users can get involved, and some crystal ball gazing about what is coming next for the SIG. If you are interested in node or pod autoscaling, definitely watch the recording.
Something I love being a part of at KubeCon is the SIG Meet n’ Greet. It is an occasion for the Kubernetes SIGs (Special Interest Groups) to make some space and do a little self-promotion. I represented SIG Cloud Provider and had a number of interesting discussions with people who are interested in what the SIG does, and also how they can build cloud controllers for their own infrastructure offerings. I also had a few people approach me about Karpenter related topics, which was nice.
My friend and teammate Joel Speed also had a talk on Thursday about CEL validation budgets. If you are using CEL with your Kubernetes API designs, I think it’s worth watching the recording to learn the deep details about how validation budgets are calculated.
I ended my day at the conference by attending a talk on the OpenCost project. I am keenly interested in exploring how the Cluster API project could expose information about instance pricing. I’m not quite sure what the best way to do this is yet, but I have been wanting to explore OpenCost to see if it might be appropriate for Cluster API. I’m still not sure, but the talk I watched did help me understand some basics about OpenCost. It wasn’t quite what I was expecting, but I found it interesting as a primer.
KubeCon Day 3, Friday November 15
Last day of KubeCon, for now.
I didn’t have a lot on my agenda for Friday aside from co-presenting the SIG Cloud Provider maintainer track talk. But, I was happily surprised to see this talk about flaky tests and continuous integration. It gave me a better window into how the Kubernetes testing infrastructure is configured and deployed. I am keenly interested in this because I would like to improve the state of testing for cloud controllers. And, as luck would have it, this talk about flaky CI was happening a few slots before our talk related to testing. I highly recommend watching the recording if you have an interest in Kubernetes continuous integration testing.
- Achieving and Maintaining a Healthy CI with Zero Test Flakes - Antonio Ojea, Michelle Shepardson & Benjamin Elder, Google – Watch on YouTube
Fridays at KubeCon are always tough for me as I am usually exhausted but also want to catch up with people before we all leave. This year was no different. I spent much of my time walking around and having discussions with people (shoutout to Kevin on our talks of what will disrupt Kubernetes and the state of homelab clusters). But, as the day, and con, were winding down it was time to deliver our talk for SIG Cloud Provider:
- Building a More Resilient Future with Advanced Cloud Provider Testing - Michael McCune, Red Hat & Bridget Kromhout, Microsoft – Watch on YouTube
I’m happy and proud to say that the talk went well despite the standard technical shenanigans at the beginning. I also want to say a big thank you to Bridget as well. I have had the pleasure of co-presenting with Bridget a few times now and she is a talented and amazing person to be on stage with. I was humbled to hear the audience’s reactions to our presentation and I’m so happy that people enjoyed themselves and appreciated our delivery. Looking forward to having another opportunity like this in the future.
And with that, I started to make my way out of the building for the last time at this KubeCon. I did see a few people on the way out, and got my last hugs and well-wishes in. It was an amazing and exhausting experience as always, and I’m hopeful I can attend in London.
Thoughts and takeaways
KubeCon is a bustling place filled with ideas and excitement, and this edition was no different. Here are some of my unvarnished thoughts about my experiences:
- “AI” workloads are still white hot, but I do hear people wondering aloud when, and if, we will see profitable business models emerge from this trend.
- There are more clouds coming. As a SIG Cloud Provider co-chair, and Red Hat engineer on our cluster infrastructure team, I have a decent vantage point for viewing cloud integrations with Kubernetes. I had several direct conversations with people who are interested in writing cloud controllers for their clouds, and talked about wanting to integrate with Cluster API. This made me feel good about the health of that ecosystem.
- More people talked to me about Karpenter Cluster API than I expected. I had several in-depth conversations with people about this project and how it works. There was a genuine excitement that Karpenter could work with Cluster API to unlock its features on all the available platforms. I was happy to hear this and tried to get a sense for what people are wanting. If we can get accurate cost information available in Cluster API, I have a feeling the Karpenter provider will get more attention.
- Dynamic Resource Allocation (DRA) is almost as hot as “AI”. The push for more GPU-centric applications of DRA was present all throughout the con, with several talks being dedicated to DRA and GPU workloads. I think this just speaks to the popularity of workloads that require specific resources. And while today the talk is mostly about GPUs, I look forward to the day when we are talking about DRA for everything from CPUs and memory to customized hardware accelerators.
So, that’s it, another KubeCon in the books. I hope this retrospective gave you a taste of what the excitement is all about. And I sincerely hope that if you find this exciting, that you also may attend some day. I look forward to seeing you out there on the road, and as always, stay safe out there, and happy hacking =)