As a child video games fascinated me, and that inspiration was a large part of what drove me to learn about computers and programming. Over the years I’ve spent many wonderful hours playing, designing, and implementing games. I’ve even managed to get paid for it a few times in my life. Making games is a hobby that I love to dabble with when the time, and for those times I’ve found the Godot game engine to be a powerful and license friendly toolkit to use.
Learning Godot can be frustrating at times, but it can also be very relaxing to explore the IDE that the community has created. I’ve done several tutorials and have even created a few simple games (Warfare, Magic, Divinity, and Maps of Mnemos), but recently I’ve wanted to learn more about shooting style games. I thought that converting the “Dodge the Creeps” game from the basic tutorial into a “Shoot the Creeps” game would make for a nice exercise and I could reuse lessons learned in the original.
So, here is my take on “Shoot the Creeps”. I’ve made some inherent design choices such as fixing the player at the bottom of the screen and shooting upward, likewise my code choices might not be best idiomatic Godot but I’ve tried to follow the patterns established in the original tutorial. Shoot the Creeps source.

A note on language
I’ve chosen to use GDScript for all my examples, apologies ahead of time to folks who aren’t using that language. Perhaps in the future I will get into the other language options, but given the similarity between Python and GDScript, coupled with my love of python, it has been the path of least resistance for me.
Step 1, do the tutorial!
No, seriously, that’s what I did to start this exercise =)
Your first 2D game – Godot Engine (stable) documenation in English
Move the player to the bottom
The first choice I have made for this shooter is that the player will be at
the bottom of the screen and only move left and right, akin to classics such
as Space Invaders and Galaga. Because the game uses a node to
determine the starting position for the player, we can change that value directly.
In the node inspector, adjust the starting y position for the Main/StartPosition
node to 660, as follows:

To restrict the player movement, we need to update the Player.gd script file, mainly
by removing the options for up and down movement and also fixing up the resting
animation frame (we want the player to look upward).
--- a/Player.gd
+++ b/Player.gd
@@ -19,10 +19,6 @@ func _process(delta):
				velocity.x += 1
		if Input.is_action_pressed("move_left"):
				velocity.x -= 1
-       if Input.is_action_pressed("move_down"):
-               velocity.y += 1
-       if Input.is_action_pressed("move_up"):
-               velocity.y -= 1

		if velocity.length() > 0:
				velocity = velocity.normalized() * speed
@@ -38,10 +34,8 @@ func _process(delta):
				$AnimatedSprite2D.flip_v = false
				# See the note below about boolean assignment.
				$AnimatedSprite2D.flip_h = velocity.x < 0
-       elif velocity.y != 0:
+       else:
				$AnimatedSprite2D.animation = "up"
-               $AnimatedSprite2D.flip_v = velocity.y > 0
-

 func _on_body_entered(body):
		hide() # Player disappears after being hit.
Make mobs fly downwards
Another big design choice I’ve made is to make the mobs only fly downwards. To accomplish this, we want to restrict where they spawn to only originate from the top border, and also make them only face downward with the same directional velocity.
Side note: I think there might be a better way to do this than to use RigidBody2D, the main I reason I chose this is that the physics of the sprites can be affected by other objects in the system. It seems like a good challenge for designing a shooter would be to use non-physics based sprites.
Removing the extra spawn points is basically a reversal of the steps followed in
the Spawning mobs section of the original tutorial. By using the red
delete point tool on the Main/MobPath node, we remove the last 3 points (top
left, bottom left, and bottom right). This restricts the spawn path to only
occur along the top border.

Making the mobs face downwards and travel that direction is a short code change.
Whenever a new mob is spawned, we want to set the direction to a fixed point (PI / 2),
and then let the physics to the rest.
--- a/Main.gd
+++ b/Main.gd
@@ -31,14 +31,11 @@ func _on_mob_timer_timeout():
		var mob_spawn_location = get_node("MobPath/MobSpawnLocation")
		mob_spawn_location.progress_ratio = randf()

-       # Set the mob's direction perpendicular to the path direction.
-       var direction = mob_spawn_location.rotation + PI / 2
-
		# Set the mob's position to a random location.
		mob.position = mob_spawn_location.position

-       # Add some randomness to the direction
-       direction += randf_range(-PI / 4, PI / 4)
+       # Set the mob's rotation to face the bottom of the window
+       var direction = PI / 2
		mob.rotation = direction

		# Choose the velocity for the mob.
Create a bullet scene
Following in the patterns from the tutorial, we will make a Bullet scene so that we can efficiently spawn new bullets whenever the fire button is pressed. Bullet behavior is relatively straightforward; they should appear at the same X coordinate as the player, and then travel towards the top of the screen. They also need to have a collision box for intersecting with mobs.
Make a new scene similar to how the Player and Mob scenes were created.
Node setup
Click Scene -> New Scene from the top menu of the IDE and add the following nodes:
- Area2D (named
Bullet)
Set the children so they can’t be selected, similar to the Player and Mob scenes.
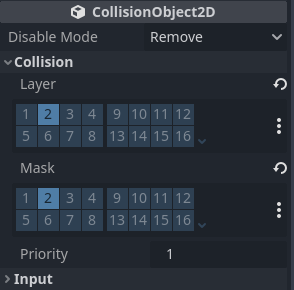
In the Area2D properties, under the CollisionObject2D
section, uncheck the 1 inside the Layer and Mask properties, and check the
2 inside both. This will make it so that we can have bullets collide with mobs
but not with the player.
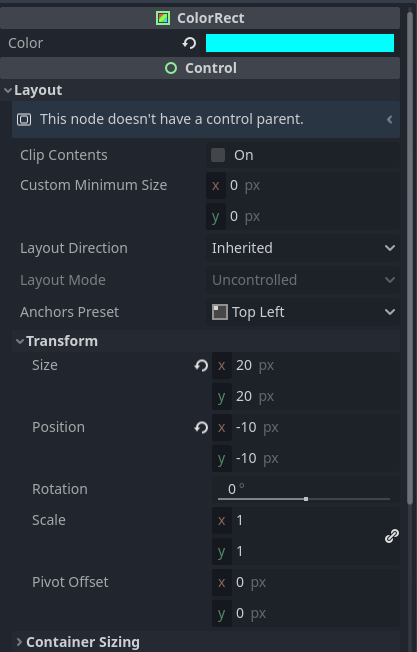
For the bullet shape, a simple square will suffice for now; a future task would be to
make a bullet sprite or animation instead. Set the ColorRect Color property
to 00ffff (or any other preferable color). Then set the x and y properties to 20 under
the Size sub-section of the Transform section. Lastly, set the x and y of the Position
property to -10. This will make the bullet track from the middle of its area. The end
result should look like this:
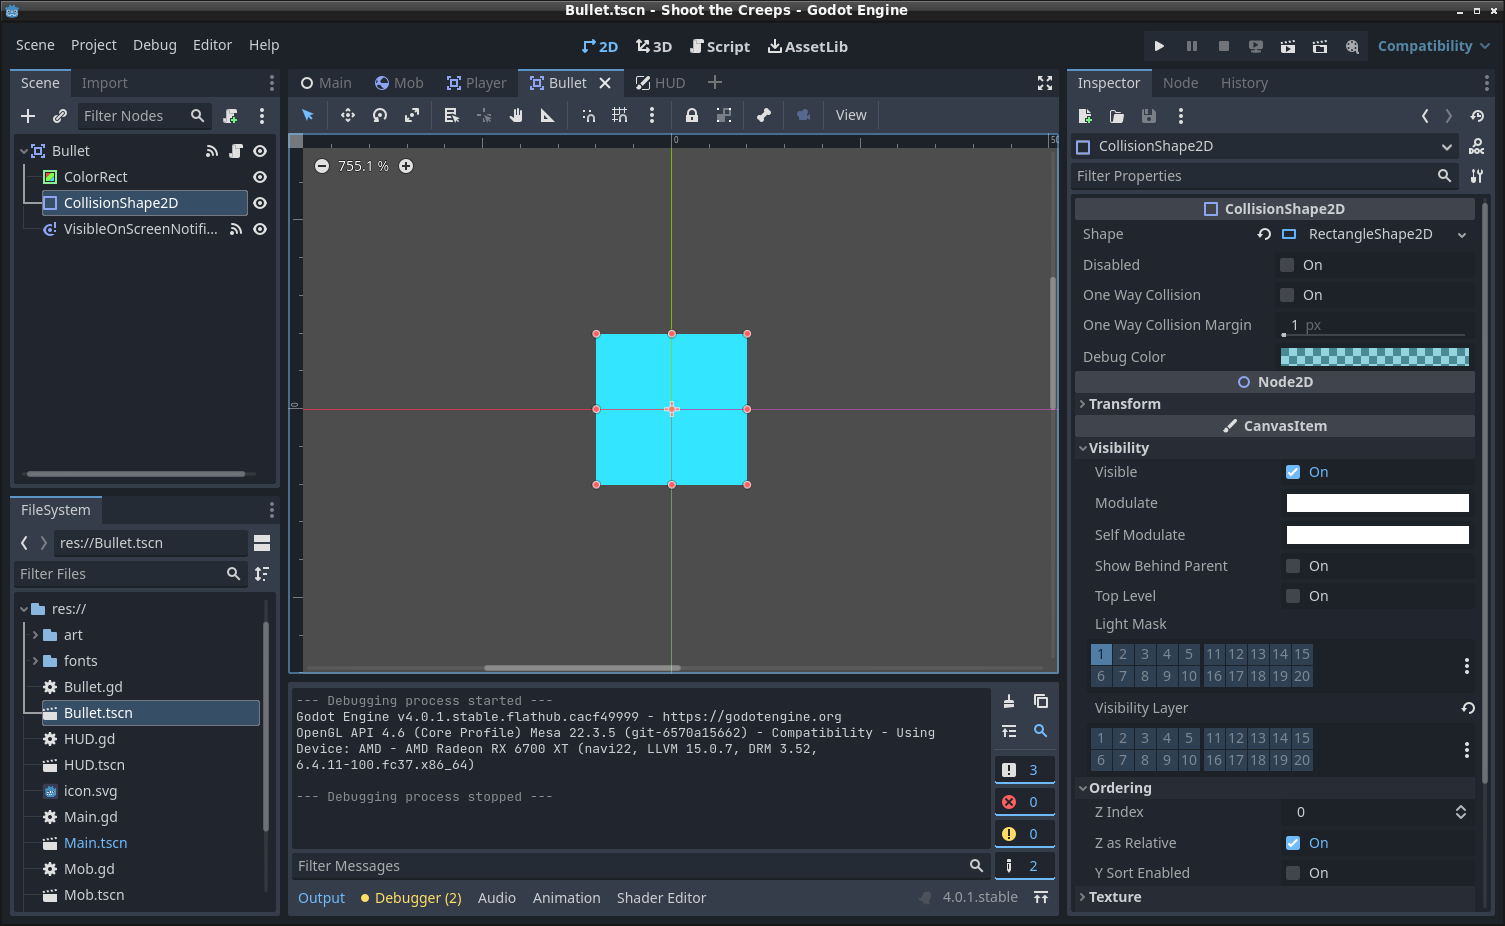
To properly detect when bullets collide with mobs we need to set the
CollisionShape2D Shape property to RectangleShape2D,
and then expand it to the size of the ColorRect. When everything is put
together it should look like this:
Bullet script
Add a script to the Bullet scene as follows.
extends Area2D
Whenever a bullet is on the screen we want it to travel towards the top, and register a hit if it collides with a mob. To begin we want to make the bullet travel.
const velocity = 200.0

func _process(delta):
	position.y -= velocity * delta
The _process function (see the Idle and Physics Processing docs) is called
with a frame rate dependent frequency. The code simply uses a constant velocity
multiplied by the time delta between invocations to move the bullet.
To register when a bullet collides with a mob, we will have the bullet emit a signal, bullet_hit,
with an argument of the mob object. This will allow the receiver to update the score and remove mobs.
We also hide() the bullet once it has collided with another entity, before finally emitting
the signal.
signal bullet_hit(mob)

func _on_body_entered(body):
	hide()
	bullet_hit.emit(body)
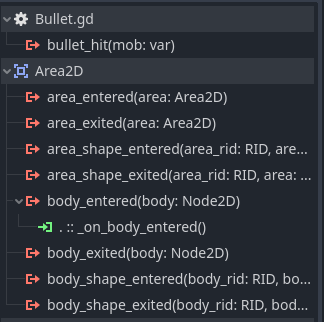
To make this work we must connect the body_entered(body: Node2D) signal from the Area2D object of
the Bullet scene to the _on_body_entered function.
Lastly, we want to ensure that any bullet that reaches the boundary of the screen is culled.
func _on_visible_on_screen_notifier_2d_screen_exited():
	queue_free()
This method needs to be connected to the screen_exited signal of the VisibleOnScreenNotifier2D
node of the bullet, similar to what is described in the “Enemy script” section of the main tutorial.
Create a fire bullet action
We want the player to trigger bullet firing when they press the space bar. To do this
we create an event in a similar manner as the “Coding the player” section from the main tutorial.
Click on Project -> Project Settings to open the project settings window and then
click on the Input Map tab at the top. Add a fire_bullet action, like this:

Player script
Since the Player object currently contains logic for handling pressed buttons, we will
add code to the GDScript file for the player to detect when the fire_bullet action
is pressed.
Update the Player.gd file to look like this:
signal fire

func _process(delta):
	var velocity = Vector2.ZERO # The player's movement vector.
	if Input.is_action_pressed("move_right"):
		velocity.x += 1
	if Input.is_action_pressed("move_left"):
		velocity.x -= 1

	if Input.is_action_pressed("fire_bullet"):
		fire.emit()
This will emit the fire signal from the Player whenever the fire_bullet action is
pressed.
Connect the fire signal to the main logic
In the Main scene we will now connect the fire signal from the Player to a
function in the GDScript for the main game logic. Update the Player child node of the
Main scene to connect the fire() signal to a function in the main GDScript named
_on_player_fire(), like this:

Create the _on_player_fire() function with an empty body for now.
func _on_player_fire():
    pass
Create bullets and collisions
With the bullet scene and logic for firing in place, we will now add the last pieces to create bullets on the screen and the detect when they hit mobs.
Main script
There are several changes which must be made to the main GDScript file. We will go through them in small pieces.
We will need the Bullet scene imported so that we can spawn new bullets when the
player presses the fire action.
@export var bullet_scene: PackedScene
Another piece we will want before create bullets is a way to add a cooldown period to the fire action so that the player does not create a stream of bullets (although you could change this if you want a stream of bullets!). We need a variable to gate when we are on cooldown, this variable will be used by our fire function and by a timer to be added later.
var bullet_cooldown = false
Next we add the fire function, this contains a lot of commands and will also rely on
the creation of a timer and a followup function. Update the _on_player_fire()
function as follows:
func _on_player_fire():
	if bullet_cooldown:
		return
	bullet_cooldown = true
	$BulletTimer.start()
	var bullet = bullet_scene.instantiate()
	bullet.position = $Player.position
	bullet.position.y -= 20
	bullet.bullet_hit.connect(_on_bullet_hit)
	add_child(bullet)
If the player is on a bullet cooldown then this function will return immediately.
If not on cooldown, it will set the cooldown to true, restart the bullet cooldown
timer, instantiate a new Bullet scene, set its position to the same as the player x
with a y value slightly above the player, connect the new object’s
bullet_hit signal (which we added previously in the Bullet scene) to a function
name _on_bullet_hit (which will be added next), and lastly we add the new object
as a child node to the main scene.
When we created the Bullet scene we described a bullet_hit signal to emit when
the bullet collides with another object. In the previous step we created a connection
between the newly create bullet and a function named _on_bullet_hit. We now add
that function with a single argument of the object that is hit.
func _on_bullet_hit(mob):
	mob.hide()
	score += 1
	$HUD.update_score(score)
When this function receives the signal, it first hides the mob from view, then adds one to the score, and lastly updates the score.
The last thing we need to do is create a function for the bullet cooldown timer that will be created. It should simply reset the cooldown variable, as follows:
func _on_bullet_timer_timeout():
	bullet_cooldown = false
Bullet cooldown timer
Because the player object examines the fire event input at the same frequency as the framerate, we need to restrict the number of bullets that are created. One way to do that is to create a cooldown gate in the main fire logic, which we did in the previous step. The final step to make that logic work is to add a Timer that will gate bullet creation.
Add a Timer child node named BulletTimer to the Main node. Set it’s Wait Time
property to 0.25, and check the One Shot checkbox to the on state.
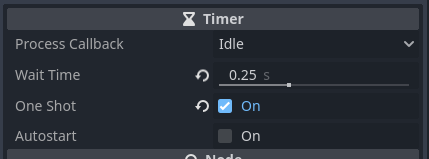
Now connect the timeout() signal from the BulletTimer to the _on_bullet_timer_timeout()
function in the main GDScript.

Update Mob collision mask
To finalize the collision mechanics between the bullet scene and the mob scene, we want
to put the Mob scene into the layer 2 collision mask.
In the RigidBody2D properties, under the CollisionObject2D
section, and check the 2 inside the Layer property. This will make it so that mobs will mask
the same layer as bullets when processing collisions.
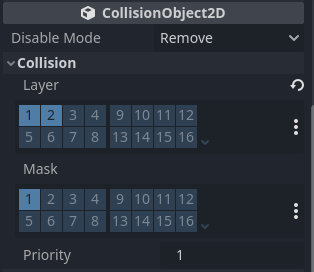
We keep the mob in layer 1 as well so that collision with the player will cause the
game to end.
Final clean up
Let’s go back and clean up a few details. To start we can remove the ScoreTimer node as
it will no longer be needed.
--- a/Main.gd
+++ b/Main.gd
@@ -9,7 +9,6 @@ var bullet_cooldown = false
 func game_over():
 	$Music.stop()
 	$DeathSound.play()
-	$ScoreTimer.stop()
 	$MobTimer.stop()
 	$HUD.show_game_over()

@@ -47,13 +46,8 @@ func _on_mob_timer_timeout():
 	# Spawn the mob by adding it to the Main scene.
 	add_child(mob)

-func _on_score_timer_timeout():
-	score += 1
-	$HUD.update_score(score)
-
 func _on_start_timer_timeout():
 	$MobTimer.start()
-	$ScoreTimer.start()

 func _on_player_fire():
As part of the final polish we will also change the heads up display message to read
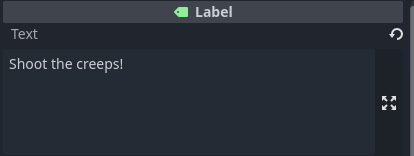
“Shoot the Creeps” instead of “Dodge the Creeps”. In the HUD scene, change the
Text property of the Label node to read “Shoot the Creeps!”.
Then change the HUD GDscript to update the message properly.
--- a/HUD.gd
+++ b/HUD.gd
@@ -12,7 +12,7 @@ func show_game_over():
 	# Wait until the MessageTimer has counted down.
 	await $MessageTimer.timeout

-	$Message.text = "Dodge the\nCreeps!"
+	$Message.text = "Shoot the\nCreeps!"
 	$Message.show()
 	# Make a one-shot timer and wait for it to finish.
 	await get_tree().create_timer(1.0).timeout
Trying it out!
Hopefully, if you’ve made it this far things are still working for you. If you are having troubles getting your version to run properly, you can find a reference that was the inspiration for this tutorial at gitlab.com/elmiko/shoot-the-creeps. If you find errors in this tutorial or the associated source code, please do not hesitate to open an issue in the repository.
The game is fairly simple with the defaults that I chose, you can have some fun by changing the bullet timer, velocity, and sizes of the mobs, player, and bullets. I wrote this modification of the main tutorial to learn more about how to build a shooter style game. I may not have chosen the most idiomatic methods for this implementation but I learned a lot and have been inspired to try out my next project.
Godot really is a tremendous platform for experimenting and developing games. I’ve found it to inspire and empower my own personal hobby pursuit of making computer games. I hope this tutorial has helped on your journey to building your passion games. Stay safe out there, and as always, happy hacking!